

Trade Less, But Wisely; Get Rich Step by Step
Master The Art of Trading
Pin Bar Trading Strategy
A pin bar pattern consists of one price bar, typically a candlestick price bar, which represents a sharp reversal and rejection of price. A 'pin bar' is a bar with a long upper or lower 'tail' or 'shadow' and a much smaller 'body' or 'real body' which exists nearer to one end of the bar. Long upper or lower tail and small real body show the rejection of the price and reversal in the market. A general thumb rule of pin bar is that its tail (either upper or lower) should be 2/3rd or more of the total bar. The end point opposite the tail is referred to as the 'nose'.

The tail of the pin bar shows the area of the price that was rejected by the market, and it signifies that price will continue to move opposite the direction of the tail points. Thus, a bearish pin bar has a longer upper tail showing rejection of higher price with the implication that price will fall in the near term. A bullish pin bar signal has a lower tail, showing rejection of lower price with the implication that price will rise in the near term.
How To Trade Pin Bars
When trading is based on pin bar pattern, the first and perhaps the most important point is to take trade at current market price. It should also be noted that pin bar pattern must be closed before taking any trade at market price. Until the par is closed as a pin bar pattern, it's not really a pin bar yet.

Another point to note is to enter on a 50% retrace of the pin bar. In other words, a trader should wait for price to retrace to about halfway of the entire pin bar's range from high to low, or 50% level, where a trade should place a limit order.
A trader can also enter a pin bar signal by using an 'on-stop' entry, placed just below the low or above the high of the pin bar.
"At market entry" - means you place a 'market' order which get filled immediately after you place it, at the best 'market price'. A bullish pin would get a 'buy market' order and a bearish pin 'sell market' order.
"On stop entry" - means you place a stop entry at the level you want to enter the market. The market needs to move up in your buy stop or move down into your sell stop to trigger it. It is important to note that a sell stop order must be under the current market price, including the spread (the difference between sell quote & buy quote or difference between the bid & offer price), and a buy stop order must be above the market price, including the spread.
Pin Bar Signals in Trending Market
It is said that the best way to trade in any market is to trade with the trend. A pin bar entry signal, in a trending market, offer a very high probabiity entry and a good risk to reward scenario.
In Chart - 1, a bullish pin bar signal is formed in the context of an up-trending market. This type of pin bar shows rejection of lower price (the long lower tail), so it is called a 'bullish pin bar'. Rejection of price as reflected in pin bar indicates that the bulls will resume pushing the price higher.

In Chart - 2, a bearish pin bar signal is formed in the context of a down-trending market. This type of pin bar shows rejection of higher price (the long upper tail), so it is called a 'bearish pin bar'. Rejection of price as reflected in pin bar indicates that the bears will resume pushing the price lower.
Pin Bar Signals Against Trend
When trading a pin bar against the dominant trend, it is widely accepted that a trader should watch a key chart level of support or resistance. The key level adds extra weight to the pin bar pattern, just as it does with counter-trend inside bar patterns. Any time when a trader watch a point in market where price initiated a significant move either up or down, that is a key level to watch for pin bar support or reversal.

Pin Bar Combi Pattern
Pin bars can also be traded in combination with other price action patterns. In chart - 3 below, we can see an inside pin bar combo pattern. This is a pattern in which the inside bar is also a pin bar. These inside pin bar signals work the best in trending market as we see below in char - 3 below.

The pattern in chart - 4 could be considered the 'opposite' of the inside-pin bar. It is with an inside bar inside a pin bar signal. It is relatively common to see an inside bare form within the range of a pin bar pattern. Often, a large breakout move will follow an inside bar formed within a pin bar's range. Hence the pin bar + inside bar combo set up is influencing price action pattern.
Double Pin Bar Pattern
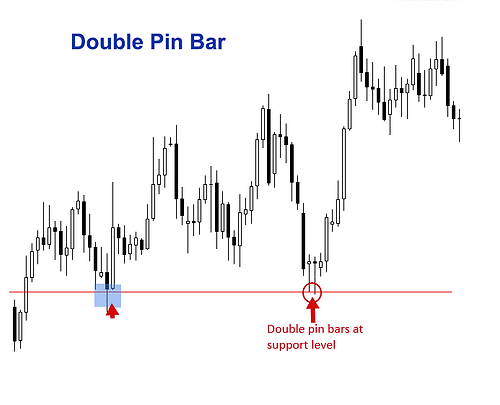

It is common to see back-to-back or 'double pin bar patterns' from at key levels of support or resistance in the market. These patterns are traded just like a normal pin bar, except they provide a trader with a little more confirmation. If fact, such double pin pars reflect two consecutive rejections of the level.
Pin Bar Pattern Trading Tips
-
In the beginning, it is easy to learn how to trade pin bars in-line with the dominant daily chart trend, or 'in-line with the trend'. Counter-trend pin bars are bit trickier and take more time and experience to become proficient at.
-
Pin bars will show up in any market. Be sure you practice identifying and trading them on a demo account before trading them with real money. Practice makes perfect.
-
Pin bars basically show a reversal in the market, so they are a very good tool for predicting the near-term and sometimes long-term, direction of price. They often mark major tops or bottoms (turning points) in a market.
-
Not every pin bar is going to be one worth trading. The best ones occur in strong trend after a retrace to support or resistance within the trend, or from a key chart level of support or resistance.
-
As a beginner, keep your eyes peeled for daily chat time frame pin bars as well as 4 hour chart time frame pin bars, as they see to be the most accurate and profitable.
-
Longer tails on a pin bar indicate a more significant reversal and rejection of price. Thus, long-tailed pin bars tend to be a little higher-probability than their shorter-tailed counter-parts. Long-tailed pin bars also tend to see price retrace to near the pin bar's 50% level more often than short-tailed pins, this means they are typically better candidates for the 50% retrace entry discussed previously.
-
When pin bar formation occurs at the top or bottom of a consolidating market, it is sign that market is taking a breather after a large directional movement and indicates that trend resumption is near.
-
Pin bars will show up in any market. Be sure you practice identifying and trading them on a demo account before trading them with real money. Practice makes perfect.
-
Sometimes different names are used in Candlestick Patterns for pin bars. A bearish reversal or top reversal pin bar formation can be termed as a 'long wicked inverted hammer', or 'long wicked doji', or 'long wicked gravestone' or 'shooting star'. A bullish reversal or bottom reversal pin bar formation can be called a 'long wicked hammer', or 'long wicked doji', or long wicked dragonfly'.
Price Action Trading Strategies
In price action trading, traders use raw price data to analyze and anticipate fure price movement of financial markets. Price action trading strategy is based on logic and simplicity, removing all external noise including news, economics and fundamental data.

The concept of 'support & resistance' is the foundation in technical analysis of any financial asset. Many technical techniques......
Continue Reading

An 'inside bar' pattern is a two-bar pattern in which inside bar is smaller and within the high low range of the previous bar.......
Continue Reading

A pin bar pattern consists of one price bar, typically a candlestick bar, which represents a sharp reversal and rejection of price......
Continue Reading

Pin bar is a price action strategy showing rejecion of price and indicating a potential reversal. An inside bar shows consolidation and.....
Continue Reading

As the name suggests, it has a false breakout from an inside bar pattern. It is also known as 'fakey pattern......
Continue Reading
